Improving your model with unlabelled data
Metascatter allows you to explore data as you choose, and how to best improve your model depends on the key requirements of your business. However, we will cover some standard methods to address errors in an intelligent way when you have unlabelled data available.
You can run unlabelled data through your trained model in the standard inference mode and also through your feature extractor model to produce the co-ordinates for the scatter plot (see Data Preparation). Often we can only label a small fraction of the unlabelled data we have and we need to prioritise which data we choose.
We will cover the scenarios below, concretised using the dog breed classification example:
- High confidence errors
- Low confidence predictions on unlabelled data
- Outliers of a particular class
- Confusion between overlapping classes
A useful tool is the k-Nearest Neighbour selector which allows you to automatically find a chosen number of the most similar images (typically in the unlabelled dataset) to a given selection. We will create a new Basket for each task.
High confidence errors
Problem: We have data that is predicted incorrectly in our test set, but with high confidence
We can filter these points as above but selecting test set data, errors, and high confidence of prediction. We can then find which of the unlabelled data points are closest to the points of contention to be sent for labelling and retraining, using the KNN Selector.
- Open the Selector tab in the Scatter plot
- Select Field Type = TEST -> Create New Selection with Rule
- AND Field Error = Incorrect -> Apply Rule to Current Selection
- AND Field Confidence > 80.0 -> Apply Rule to Current Selection
Now that the images which have been erroneously predicted with high confidence have been isolated, we want to correct for those using similar images that have not yet been used for training. To do this, we find the most similar images in the UNLABELLED data using the KNN selector.
- Select the number of similar images you want to inlcude (e.g. 100)
- Select points from UNLABELLED
- Autoselect these points - the most similar images will automatically be selected
- Open the Basket tab
- Create a new basket and name it
- Add the N points to the basket
These images and their metadata can then be exported out of the tool for labelling.
Low confidence predictions on unlabelled data
Problem: When unlabelled data are run through the model they are classified with low confidence, indicating lack of surity of the model
It is likely that the model has not be trained on images that look like these. These points can be filtered and added directly to the basket to be sent for labelling.
- Open the Selector Tab in the Scatter Plot
- Select Field Type = UNLABELLED -> Create New Selection with Rule
- AND Field Confidence < 20 -> Apply Rule to Current Selection
- Open the Basket Tab
- Create New Basket and name it something sensible
- Add the points to the Basket
Outliers of a particular class
Problem: There are some images which fall far from the other images in their class
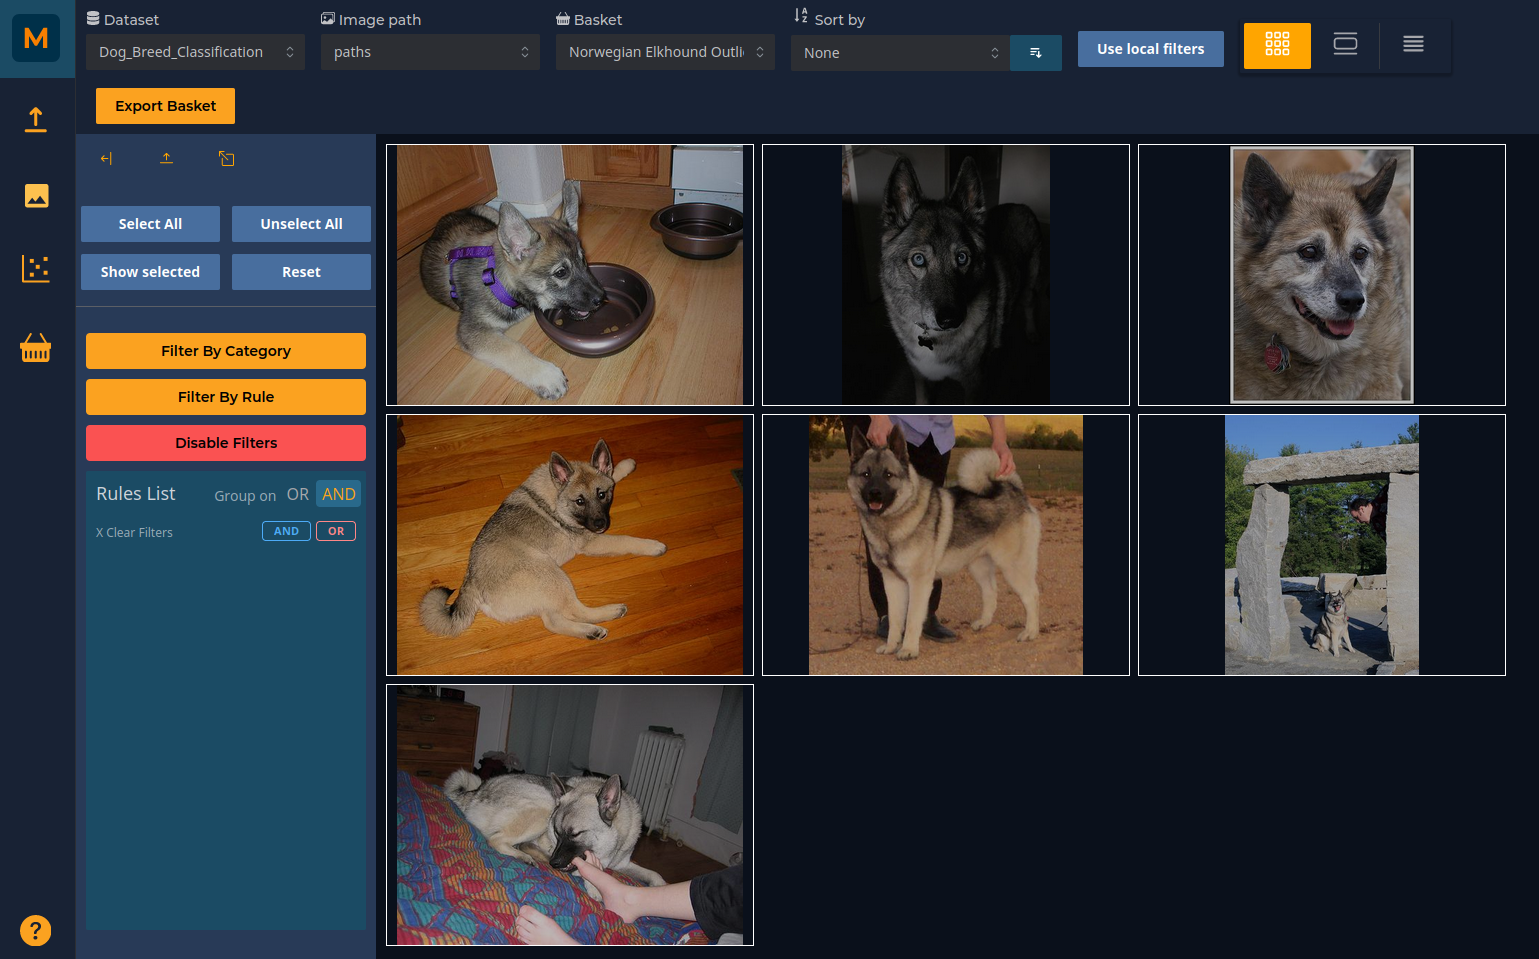
For instance, we want to examine the outliers of the class Norwegian Elkhound.
- Open the Selector tab of the Scatter plot
- Select Field Labels = Norwegian Elkhound -> Create New Selection with Rule
- Use the Intersection Selection Tool from the top horizontal menu to draw around only the outliers from the class
- Open the Basket tab
- Create a New Basket
- Add the selected points to the Basket
Selecting these outliers and adding them to a new basket allows for further exploration. Perhaps the classifier does not work well on images with poor lighting? Or perhaps the presence of other objects in the images is a source of confusion?
Confusion between overlapping classes
Problem: Two classes often get confused with each other
Overlapping clusters indicates that two classes are getting frequently confused for each other. More training data in this decision boundary might help the classifier. We can add nearest neighbours to the area of confusion from the unlablled dataset.
You can scan the scatter plot to get an overview of where confusion occurs. Taking the example of the Clumber and dog breed classes which overlap.
- Open the Selector tab of the Scatter plot
- Select Field Labels = Weimaraner -> Creat New Selection with Rule
- OR Select Field Labels = Clumber -> Apply Rule to Current Selection
- Use the Intersection Selection Tool from the top horizontal menu to draw around the decision boundary
- From the KNN selector, enter the number of similar images you want (e.g. 20)
- Select points from UNLABELLED
- Autoselect points
- Open the Basket tab
- Create a New Basket with a sensible name
- Add the selected points to the Basket
Dataset References
[1] Aditya Khosla, Nityananda Jayadevaprakash, Bangpeng Yao and Li Fei-Fei. Novel dataset for Fine-Grained Image Categorization. First Workshop on Fine-Grained Visual Categorization (FGVC), IEEE Conference on Computer Vision and Pattern Recognition (CVPR), 2011.
[2] J. Deng, W. Dong, R. Socher, L.-J. Li, K. Li and L. Fei-Fei, ImageNet: A Large-Scale Hierarchical Image Database. IEEE Computer Vision and Pattern Recognition (CVPR), 2009.