Basic usage: Scatter plot
We will cover:
- Using the selector to explore data
- Using the filters to explore data
- Adding selected points to the basket
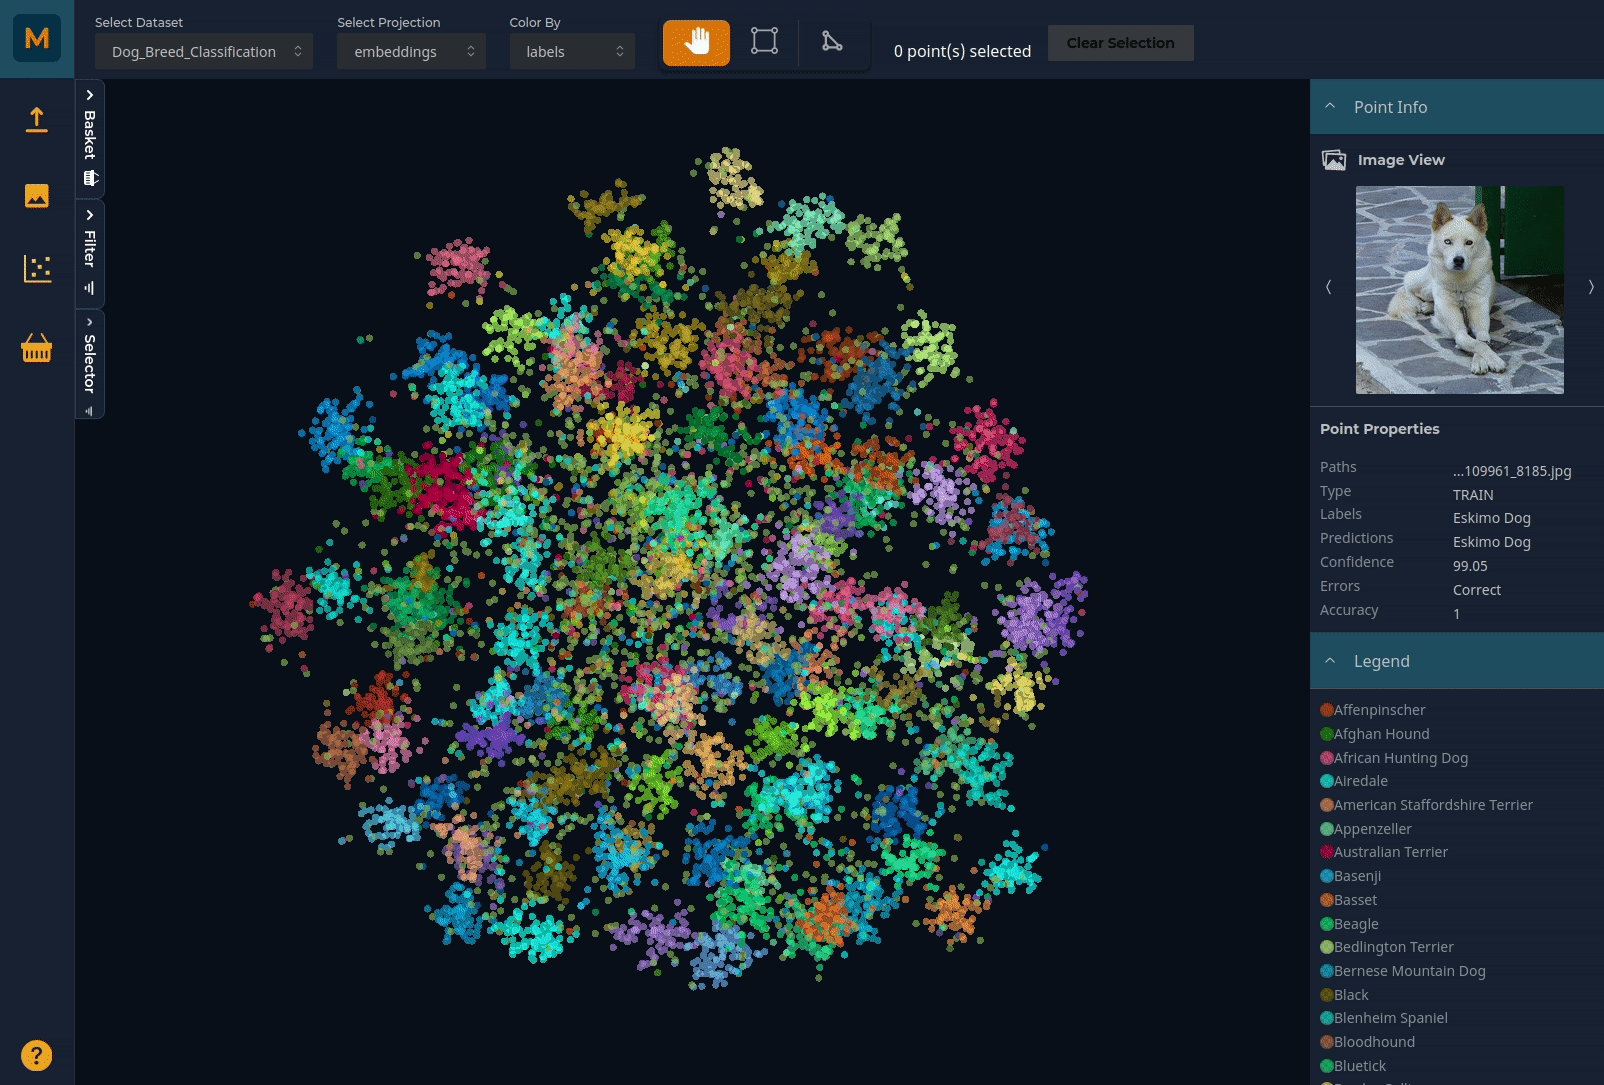
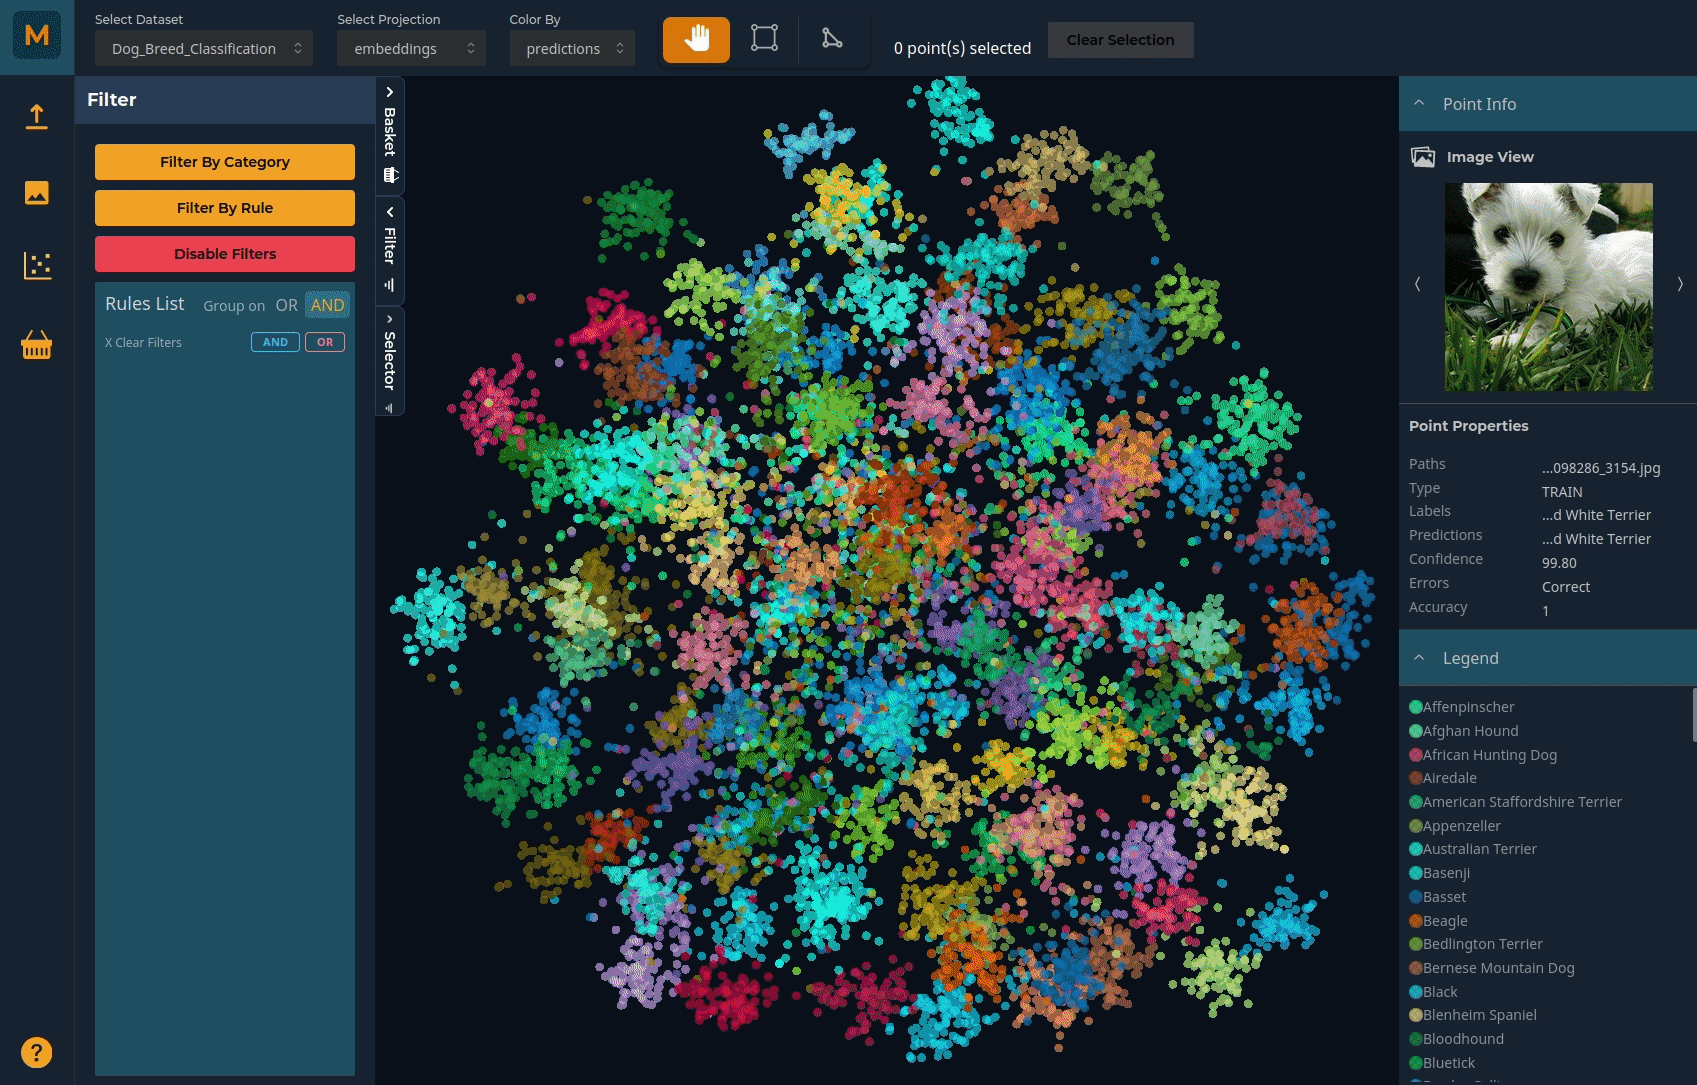
The scatter plot gives you a birds-eye view of your dataset. Each point on the scatter plot represents an image in the dataset based on the dimensionality reduction methods used in Data Preparation. If you have extracted features from a deep learning model, this will show how the model 'sees' the image data. For instance, in this example, a model has been trained to classify images into one of 120 dog breeds. You can see the clusters broadly representing each breed in the scatter plot.
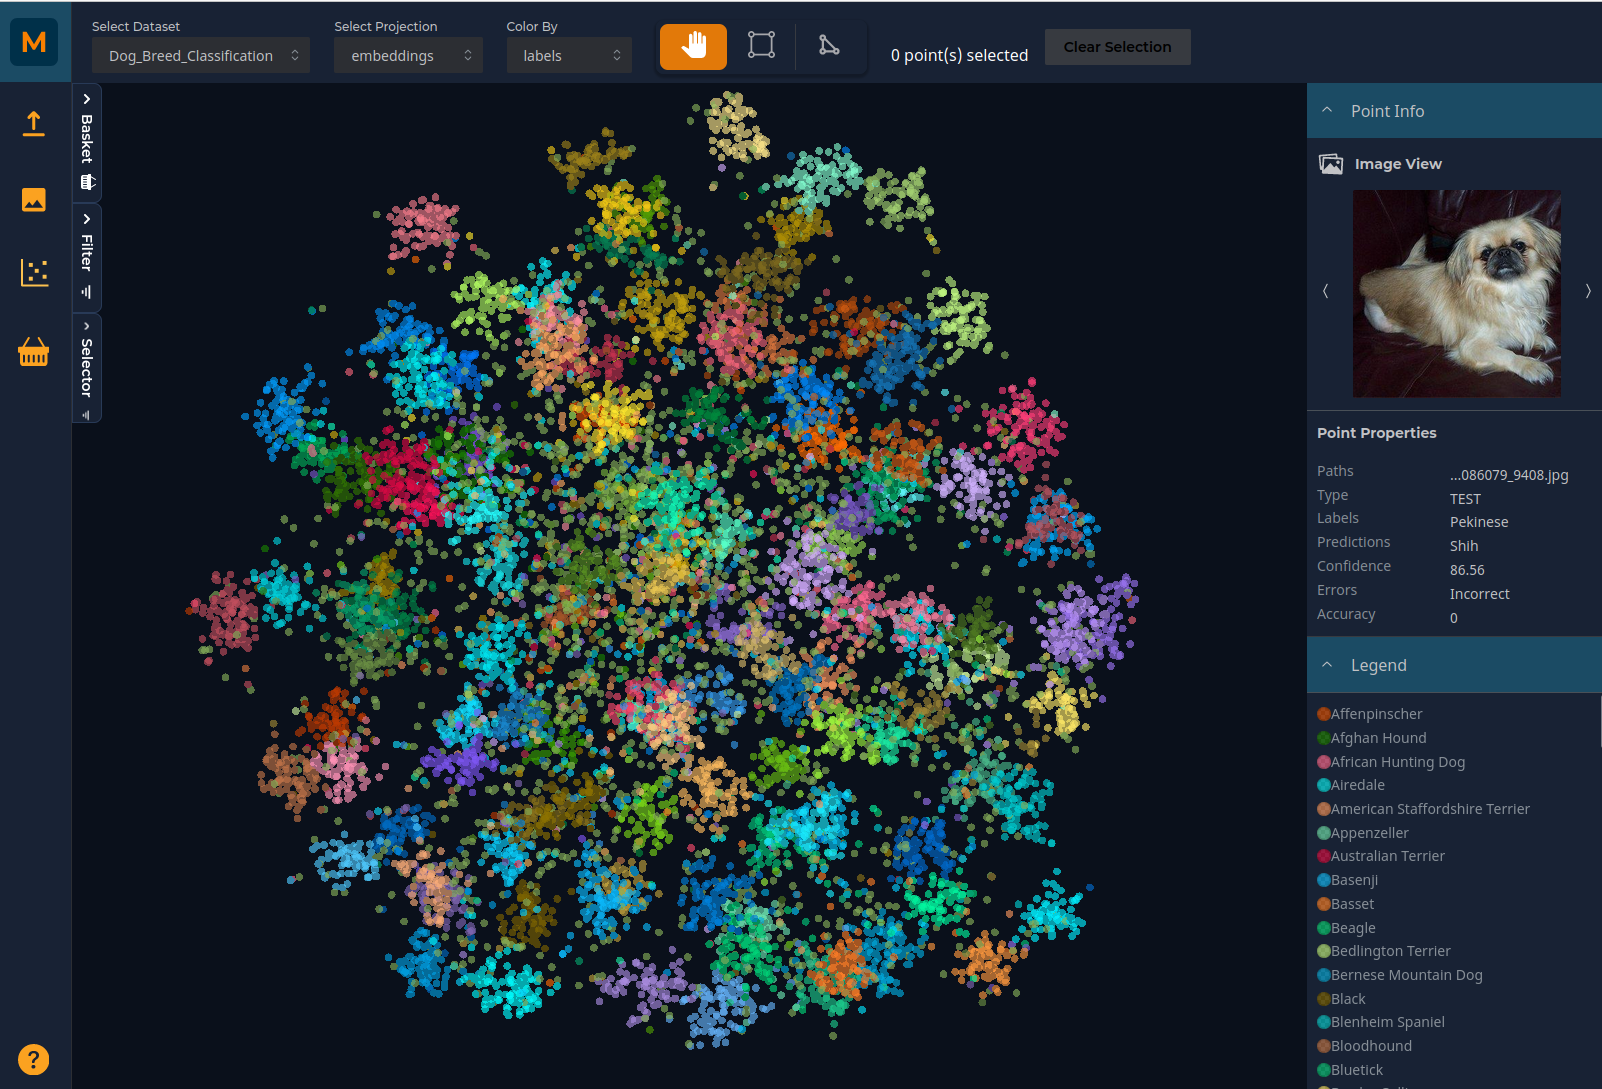
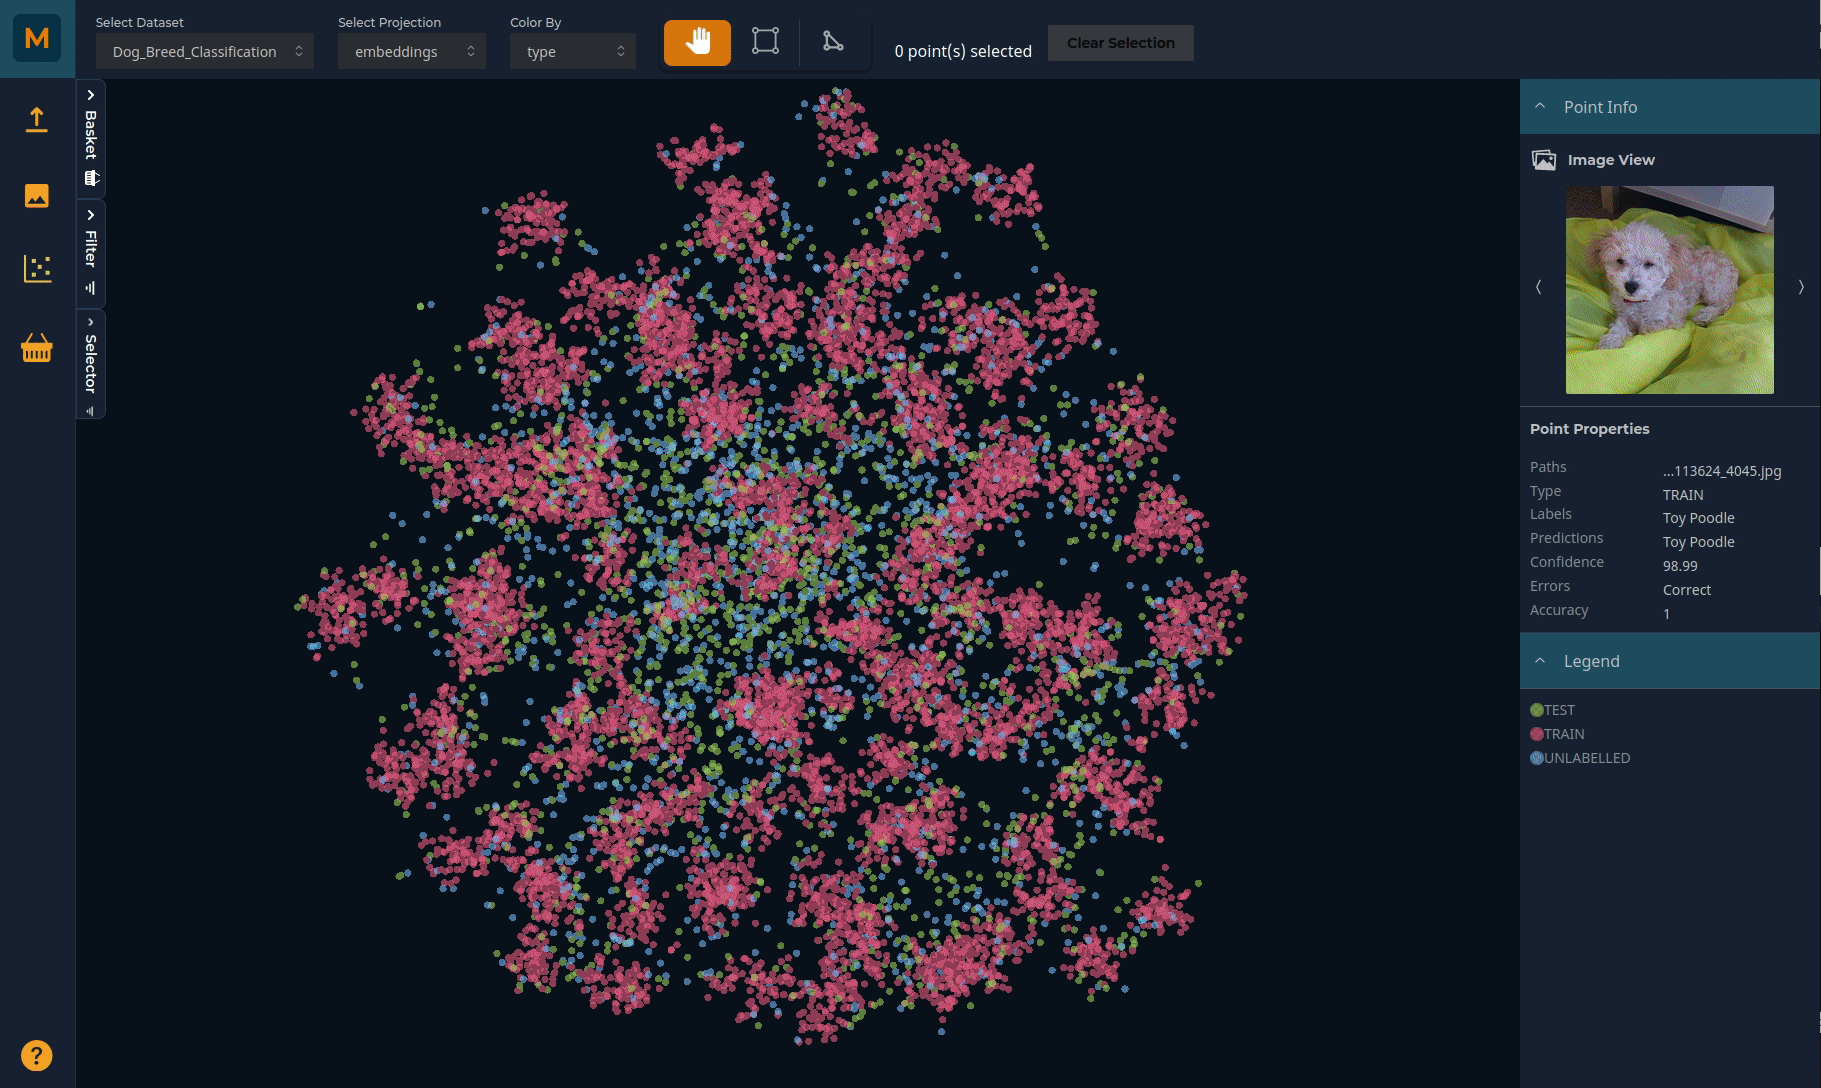
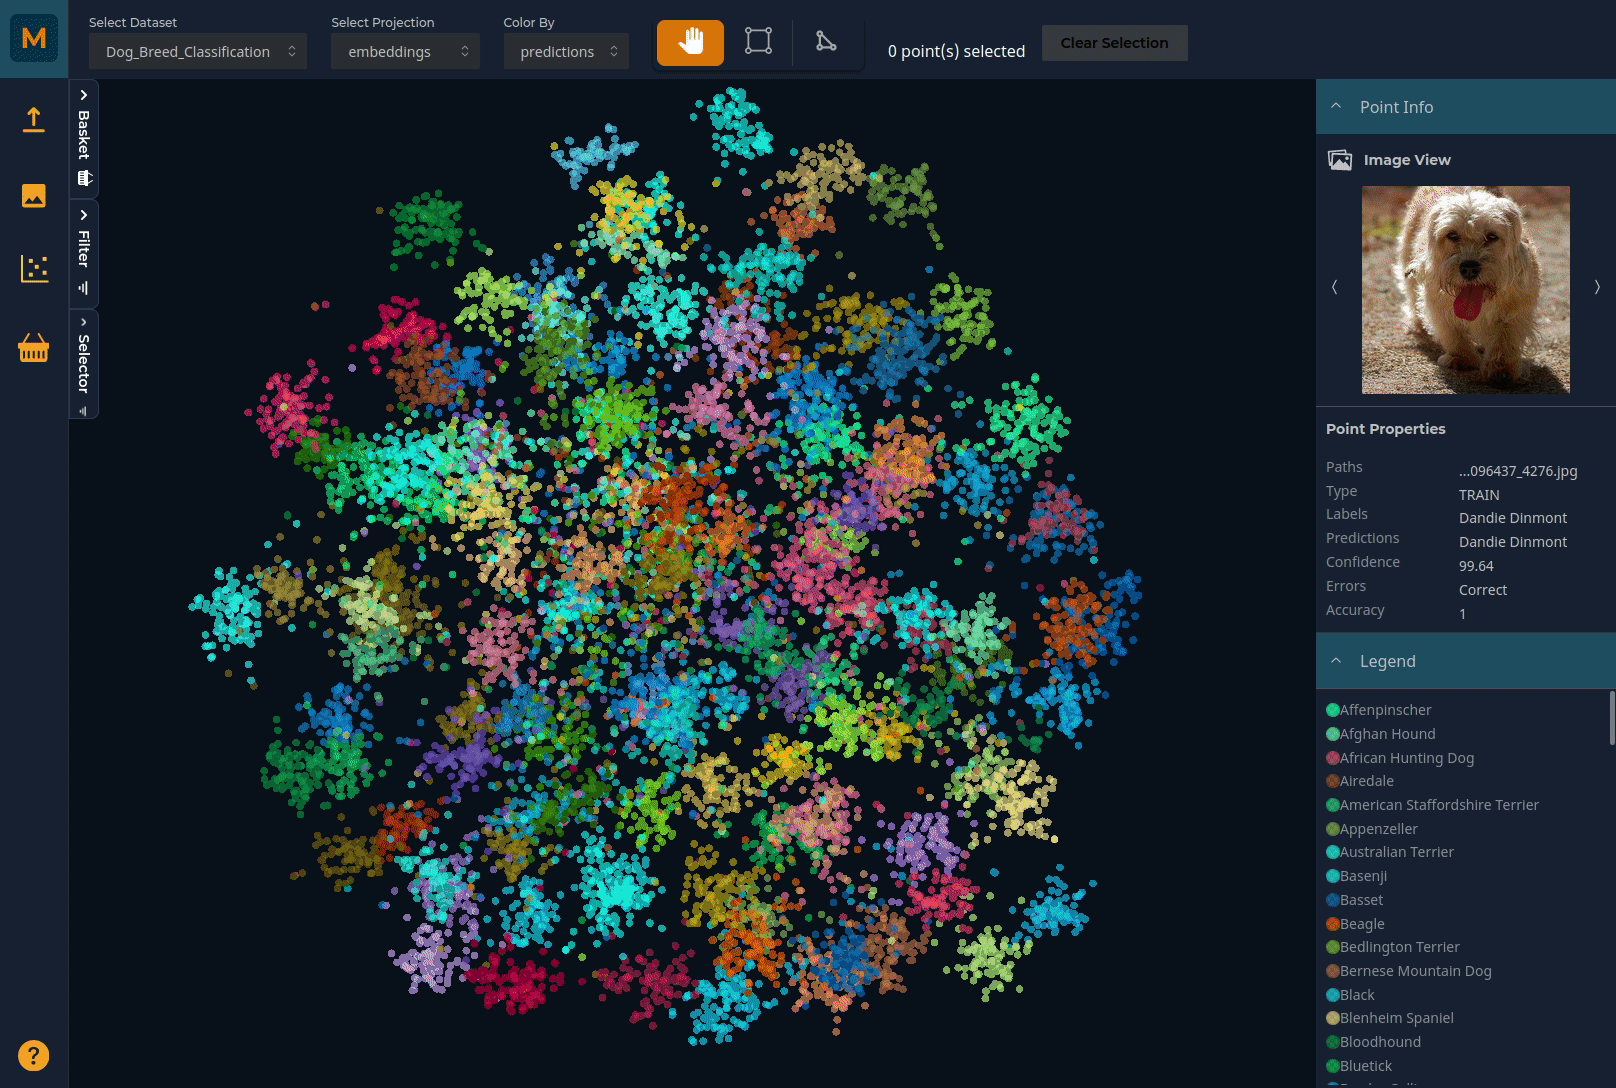
You can pan through the plot using the left mouse button and zoom using the scroll (or zoom on Mac). Selector tools on the top horizontal menu bar allow you to select subsets of the data by drawing around the relevant points. You can colour the plot by any of the metadata you have uploaded:
Using the Selector to explore data
You can use the Selector panel on the left to highlight regions of interest. For instance, to explore the predictions of a particular image class and why some images may be predicted poorly
Using the Filters to explore data
To isolate only the data you are interested in, you can also filter relevant points to reduce the amount of data to explore. For instance, we can filter for only TEST images which are predicted INCORRECTLY.
Tip
Note that filters applied in the scatter plot will also be applied in the Image Explorer and vice versa.
Adding selected points to the Basket
Having filtered for data of interest, you can then add subsets to a Basket for further offline work. For instance, we can filter for low-confidence predictions in the unlabelled dataset. While we do not know the ground truth of these images, we know that the model is not sure how to classify these, and so we may want to label these and retrain the model.
Once we have isolated those points, we can select them with the polygon or rectangular selection tool and create a basket for this subset, using the panel on the left. You can create different baskets for different tasks. Adding the points to the relevant basket allows you to explore them in more detail in the Basket page and export them outside of Metascatter.